
So far in this series on ELK (Elasticsearch-Logstash-Kibana) stack, we have talked about Elasticsearch and Kibana(here and here). It’s about time we look at the third pillar of this stack – Logstash.
So, what is Logstash?
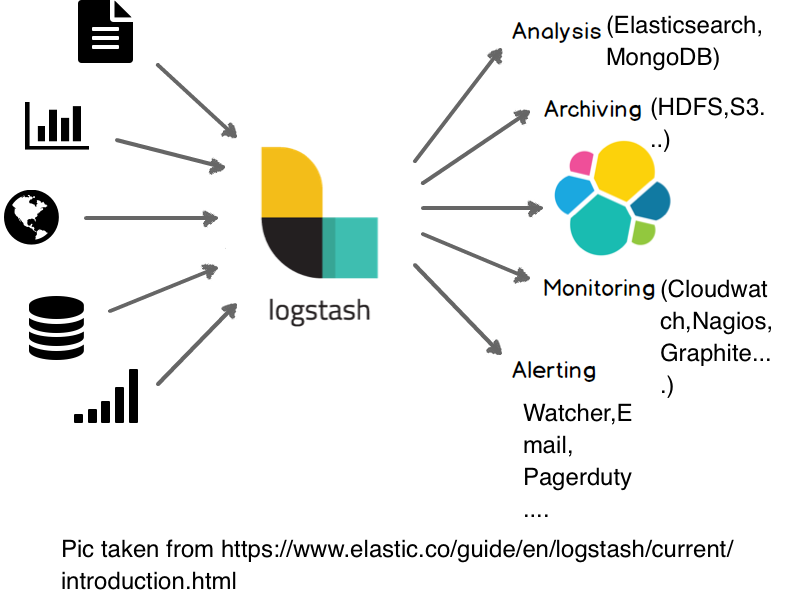
Logstash is an open source data collection engine with real-time pipelining capabilities. This implies that Logstash can dynamically put data from different sources together and clean/filter the data and send it to any output destinations we need. It’s a pluggable architecture that allows great flexibility. Logstash can take a wide variety of unstructured data and then clean it and transform it to gain near real-time insights immediately.
What is Grok?
As mentioned in Logstash documentation -“Grok is the bread and butter of Logstash filters and is used ubiquitously to derive structure out of unstructured data.” A bit more details on Grok will help you understand Logstash better, please see :
https://www.elastic.co/guide/en/logstash/6.4/plugins-filters-grok.html
We will now jump directly into Logstash installation.
Run the following at command line of your ubuntu server
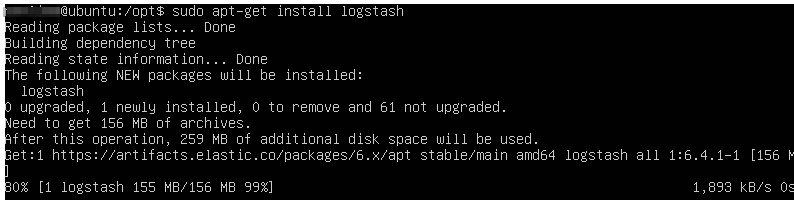
$sudo apt-get update && sudo apt-get install logstash
Information about updated versions of packages is checked with “update” command and hence is run before every installation.
Once the installation is complete, we can test Logstash with a very basic Logstash pipeline (the concept of Logstash pipeline is like so : {inputs->filters->outputs}).
$/usr/share/logstash/bin/logstash -e 'input { stdin { } } output { stdout {} }'
The input is stdin and the output is stdout. Once Logstash is up and running, we can enter “hello world” on the command line and Logstash prints it back with the timestamp, version and host. This confirms that the setup is working.

If you prefer to test with a sample log file, then we can do so by downloading apache log file and creating the configuration file required for Logstash.
Elasticsearch documentation provides sample apache log files to test Logstash. To download, type the following at command prompt
$wget https://raw.githubusercontent.com/elastic/examples/master/Common%20Data%20Formats/apache_logs/apache_logs
The file can also be accessed from https://github.com/elastic/examples/tree/master/Common%20Data%20Formats/apache_logs
The configuration file can be created like so
$sudo vi /etc/logstash/conf.d/logstash.conf
This will open an empty file. Press “Esc and then i” to get into “insert” mode and copy the following:
input {
       file {
           path => "/home/<YOUR_USER_NAME"/apache_logs"
           start_position => "beginning"
           ignore_older => 0
          }
}
filter {
         grok {
                 match =>  { "message" => "%{COMBINEDAPACHELOG}" }
                }
          date{
                 match => [ "timestamp" , "dd/MMM/yyyy:HH:mm:ss Z " ]
                }
}
output {
          elasticsearch {
                     hosts => [ "localhost:9200" ]
                   }
          stdout {
                  codec => rubydebug
                }
}
Please replace the placeholders above with the relevant values for you. Once done, press “ESC + wq!”. This will save the data into the file and exit the editor.
A Logstash pipeline accepts inputs and filters of our choice and outputs to destination/destinations of our choice. This is exactly what we are defining in the config file above. In the input section, we specified the file we want Logstash to monitor and then explicitly mentioned that we want it to start reading from the beginning. Otherwise, Logstash only checks for the updates (i,e. tails the file) and by mentioning ignore_older, we are telling Logstash to consider old files too.
In the output section, we are specifying that we want the output redirected to Elasticsearch that is running on port 9200 on our local machine. Apart from this, we also want it to display the output to standard output i,e. our screen. codec is the name of Logstash codec. Codecs provide a way to encode and decode input and output data.
Run Logstash with the config file like so
$/usr/share/logstash/bin/logstash -f /etc/logstash/conf.d/logstash.conf
(note – Logstash dumps a lot of messages on the screen and may take sometime to start up)
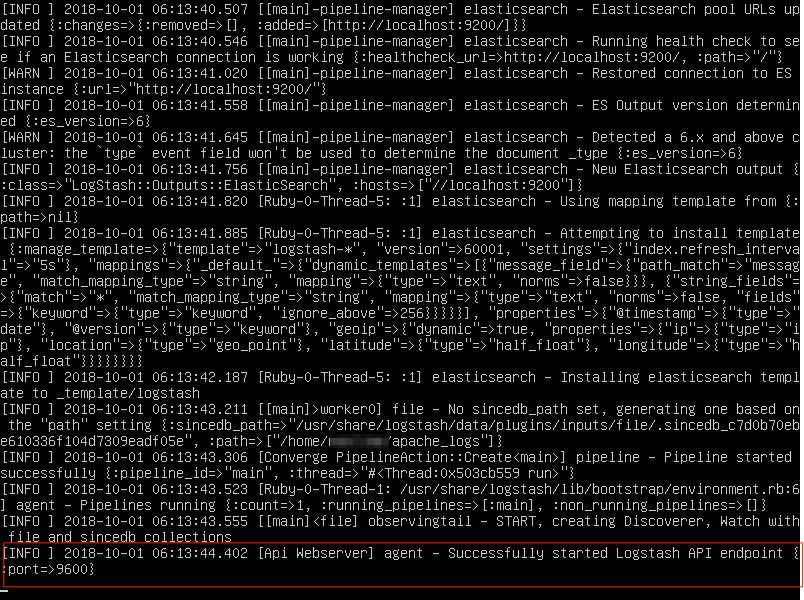
Successfully started pipeline implies Logstash started correctly and is listening to any changes on the log file. Any new updates to the log file will be displayed here.
For exhaustive list of options for the config file, please check the Elasticsearch official documentation – https://www.elastic.co/guide/en/logstash/current/configuration-file-structure.html
Examples for config file can be referenced on – https://www.elastic.co/guide/en/logstash/current/config-examples.html
Troubleshooting Logstash installation:
It’s common to run into installation issues while setting up Logstash. We have described some common cases here.
Unrecognized VM option ‘UseParNewGC’

This indicates that the Java version on the system is not compatible with Logstash. At the time of writing of this post, Logstash requires java 8 and is not compatible with higher versions. So, first let’s check the version present on our system
$java -version

To check all the java versions available on the system, you can type
$update-java-alternatives --list
This will display the available java versions. From the screenshot below, we can see that java version 8 is already present on the system.

So, we can either make version 8 as default version or export the java_home variable. We will export java_home and then run logstash.
$echo $JAVA_HOME

$export JAVA_HOME="/usr/lib/jvm/java-8-oracle"
echo $JAVA_HOME will display the path of java home if its set. A blank implies java home variable is not set. This command gives the complete path to java installation and we can use it in the export command to set new java_home variable.
Once export runs successfully, you can use “echo” command as shown above and check if the java_home is set to version 8. You can then start Logstash and it should run successfully.
In case java version 8 is not available on your system, you can download either from oracle or from openjdk.
$sudo apt-get install oracle-java8-installer
Installation will dump a lot of messages on the screen as shown below
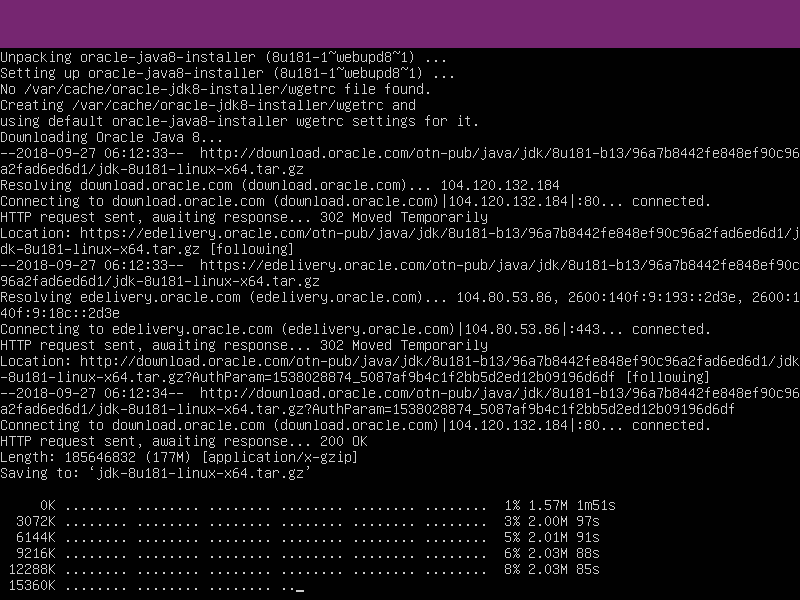
You can now export this path into java_home and run Logstash again and it should be good to go.
With this we are moving closer to our final post in the ELK series, wherein we will talk about a case study outlining a real life use case involving ELK stack. Stay tuned!
Comments